Introducing Excel 2013 New Function "Graph Former Control"!
There are surprisingly many opportunities to edit the created graphs.This time, we will introduce the new features installed in Excel 2013, the graph format control!
■ "Graph format control", which can edit the graph that adjusts the displayed item with a graph filter, is a Suguremonono that can be edited directly from the three icons in the upper right right when selected the created graph and directly edit the graph.
"Graph element", "graph style", and "graph filter" are prepared.You can quickly process the graph, such as the presence or absence of each element, the style change, the filtering of the displayed data and the change in the reference range.
Step1 Adjust the display item with the graph filter
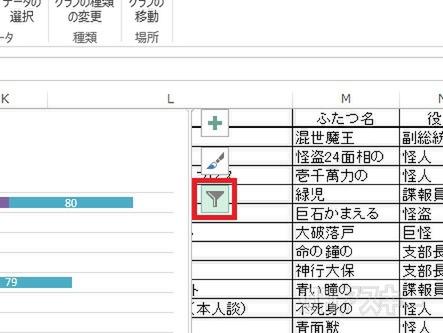
↑ Select the graph and select the “graph filter” below the displayed “graph format control”.
↑ Items that make up a graph, such as “series” and “category” are displayed for each genre.You can change the filtering conditions.
Step2 Filter the graph content and members
↑ You can filter by operating the check.For example, if you uncheck the "command" item and choose "Application" ...

↑ “Command" item is filtered and hidden.Not only graphs but also members can be controlled.
Step03 Calling the selection of data sources
↑ “Graph filter” can also edit data sources.Click "Select data" at the bottom of the menu.
↑ “Select data source" Window is displayed.In addition to editing a legend (affiliate) and axis (item), it is possible to replace the line.
Edit the reference range of Step04 series and item data
↑ In addition to adding and deleting the items to be displayed, it is possible to edit the selection.Select the item you want to edit and select the "edit" button.
↑ “The editing of the series" window is displayed.You can edit the reference range of the label reference cell and graph.The reference data is displayed on the right.
Step05 freely controls the cell range to refer to
↑ When you select a reference button in the “affiliated value”, the range that is referenced is displayed.For example, if only one person is removed from the selection ...
↑ Reflected on the graph side, only the members who have been removed are hidden.Adjust the value display/hidden in detail.
■ Change the maximum value and unit according to the graph content
If you edit the graph, you may not be able to display the graph or make it difficult to read the graphs.In such a case, let's change the maximum value and display unit of the scale by "formatting the axis".
↑ “Select the graph element icon icon and select“ Axis ”from the list.
↑ Let's select other options from the displayed sub menu.
As mentioned above, I have seen "Graph format control" in Excel.Please use it for practice.
"Excel Dojo -Secret Society Extension" is being popularly serialized in the Weekly ASCII magazine.Please check it out and enjoy Midori's great struggle!


